Healthcare spending continues to rise at the fastest rate in our history. The US 2021 healthcare spending was $12,318 per capita, and the following infographic shows that the US spent twice more on healthcare compared to most other advanced economies:
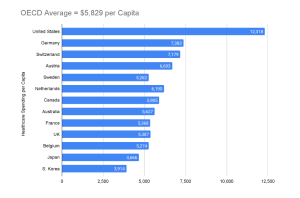
Figure 1. US spent twice on healthcare in 2021 as compared to the average of most other wealthy countries. Source: (Infographic: U.S. Healthcare Spending, Peter and Petersons Foundation, 2023).
In 2005, total national healthcare costs rose 6.9%—twice the inflation rate—reaching $2 trillion, or $6,700 per person. Currently, total healthcare spending represents 16% of the gross domestic product (GDP). In the next decade, U.S. healthcare spending is expected to increase at similar levels, reaching $4 trillion in 2015 (Borger et al., 2006). After the 2020 COVID-19 pandemic, healthcare costs rose 9.7% to $4.1 trillion due to unexpected federal spending (National Coalition on Health Care, n.d.). National Healthcare Expenditure (NHE) increased 2.7% in 2021 from the previous year to an astounding $4.3 trillion, or $12,914 per person, representing 18.3% of GDP. Medicaid spending increased by 9.2% to $734 billion, accounting for 17.0% of total NHE spending, while Medicare spending jumped by 8.4% to $900.8 billion, accounting for 21% of total NHE spending (CHCF, 2022).
Healthcare experts, however, estimate that 25% of US healthcare spending is wasted on ineffective, unnecessary, expensive, wasteful services or a mix of all four. Many experts maintain that our healthcare system is costly because it’s riddled with inefficiencies, excessive administrative expenses, inflated prices, poor management, waste, inappropriate care, and fraud (Schatsky et al., 2019). However, at least three remaining key factors—namely, the aging population, expensive medical innovation, and defensive care—contribute substantially to the overall cost picture. Let’s look at these three factors:
1. Aging population
In the United States, the proportion of the population aged 65 and over is projected to increase from 12.4% in 2000 to 19.6% in 2030. The number of people aged 65 years and over is expected to increase from approximately 35 million in 2000 to an estimated 71 million in 2030, and the number of people aged 80 and over is expected to increase from 9.3 million in 2000 to 19.5 million in 2030. According to a United Nations report, “the growing number of older adults increases demands on the public health system and on medical and social services. Chronic diseases, which affect older adults disproportionately, contribute to disability, diminish the quality of life, and increase health- and long-term-care costs.” (Ernst & Young, 2006). As many as 125 million Americans have one or more chronic conditions (e.g., congestive heart failure, diabetes). Chronic diseases account for 75% of all healthcare expenditures (Espicom Business Intelligence, 2006).
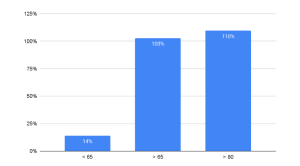
Figure 2. The Oldest Population Sector is Growing the Fastest (2000-2030)
Table 1. By 2030, 20% of the US population will be 65 or older.
| 2000 (Millions) | 2030 (Millions) | |
| < 65 | 238 | 271.7 |
| > 65 | 35 | 71 |
| > 80 | 9.3 | 19.5 |
Notably, Population Reference Bureau’s Population Bulletin explores current trends and disparities among persons 65 and older and how baby boomers born between 1946 and 1964 transformed America’s older population (Mather et al., 2019). The baby boom generation has fueled an extraordinary increase in the 65-and-older population. The 65-and-older population will nearly double from 52 million in 2018 to 95 million by 2060, and its percentage of the total population will climb from 16 percent to 23 percent. U.S. Baby boomers (55–73 in 2019) have presented both challenges and opportunities to the economy, infrastructure, and institutions.
- The positive developments include:
- The decline in older-age mortality boosted U.S. life expectancy from 68 years in 1950 to 78.6 years in 2017
- Gender life expectancy is closing. In 1990, men lived seven years longer than women. By 2017, the spread was five years (76.1 vs. 81.1) .7
- Challenges include:
- Obesity rates among 60-year-olds rose to 41% in 2015–2016
- The aging baby boom generation might raise the number of Americans 65 and older needing nursing home care by more than 50% to 1.9 million in 2030 from 1.2 million in 2017.
- Social Security and Medicare spending will rise from 8.7 percent of GDP to 11.8 percent by 2050 due to the high number of older persons.
- The number of Americans with Alzheimer’s disease might treble by 2050 to 13.8 million from 5.8 million, driving demand for elder care (Mather et al., 2019).
2. Expensive medical innovation
The American biotechnology industry has surpassed pharmaceutical companies for the third straight year as the primary source of new medicines, and biotech revenue jumped nearly 18% from 2004 to 2005, reaching $63.1 billion (Ernst & Young, 2006).
The United States is the world’s largest and wealthiest pharmaceutical market, accounting for around 48% of the world’s total. Per capita expenditure The United States is the world’s largest and wealthiest pharmaceutical market, accounting for around 48% of the world’s total. Per capita expenditure on drugs was $1,069 in 2006, nearly double that of the rest of the world (Espicom Business Intelligence, 2006). The global pharmaceutical market was valued at approximately 955 billion U.S. dollars in 2020, representing a growth of around 375 billion U.S. dollars from 2006, when the market size was estimated at around 580 billion U.S. dollars (Statista, 2023)
An estimated 30% of new products under development are “combo products”—involving medical devices embedded with pharmaceutical or biologics components (Richter, 2007). The combination products market was estimated at $5.9 billion in 2004 and is expected to grow at a compound annual rate of 10% through 2009. By that year, the market is expected to reach approximately $9.5 billion worldwide, with most revenues from drug-eluting stents and steroid-eluting electrodes (Dubin, 2004). In 2004, the U.S. held approximately 65% of the drug-device combination product market. By 2010, the U.S. had been projected to hold 57% of that market. The global combination products market was valued at $89.9 billion in 2020 and is expected to grow at a compound annual growth rate (CAGR) of 11.5% from 2021 to 2028 (Grand View Research, 2023).
3. “Defensive” medicine
Defensive medicine, where doctors order needless tests and referrals to avoid lawsuits, costs $50 billion to $65 billion yearly (Dyrda, 2022). President George W. Bush said in a 2004 speech: “One of the significant cost drivers in the delivery of health care are these junk and frivolous lawsuits. The risk of frivolous litigation drives doctors—and hear me out on this—they drive doctors to prescribe drugs and procedures that may not be necessary just to avoid lawsuits. That’s called the defensive practice of medicine . . . …See, lawsuits not only drive-up premiums, which drives up the cost to the patient or the employer of the patient, but lawsuits cause docs to practice medicine in an expensive way to protect themselves in the courthouse. The defensive practice of medicine affects the federal budget. The direct cost of liability insurance and the indirect cost of unnecessary medical procedures raise the federal government’s health care costs by at least $28 billion annually (Bush, Speech at Baptist Bush, G. W., 2004).
In the previous decade, according to working for the Patient Safety Network, Defensive Medicine is responsible for driving rising healthcare expenditures. 80%–90% of clinicians practice defensive medicine to document and protect themselves from lawsuits (Sethi, 2010).
According to the Medscape Surgeon Malpractice Report 2021 (Gallegos, 2021),
- 77 percent of doctors have been sued, with 65 percent citing surgery and therapy difficulties.
- 82% of sued doctors thought the lawsuit was unnecessary, and 38% were surprised.
- Only 17% of the lawsuits resulted in a favorable decision for the doctors (Dyrda, 2022).
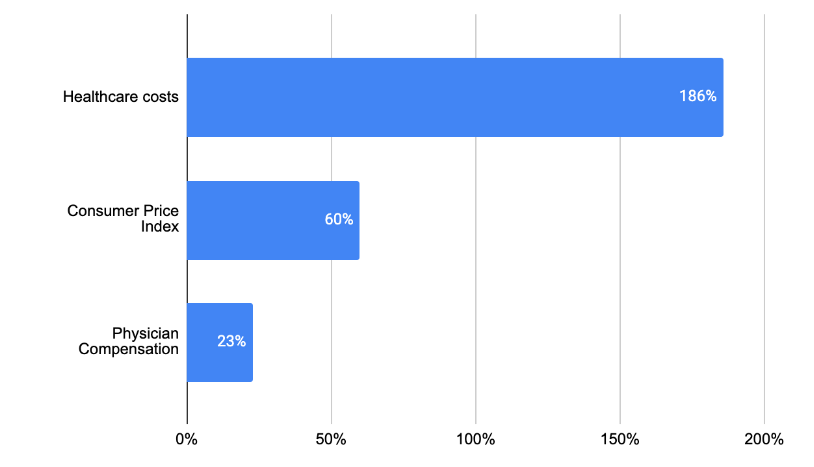
The disparity between Healthcare costs and Physician Compensation
Now let’s observe the paradox. On the one hand, the participants of every ancillary industry to healthcare—including insurance companies, high-tech and pharmaceutical engineers, scientists, and lawyers have increased their profits in step with the rising healthcare costs at an ever-accelerating pace. On the other hand, medical practice owners—the actual healthcare providers—have failed to keep up with rising costs and lost a significant part of their income. In fact, between 1995 and 1999, when most wages and salaries in the United States rose 3.5% after adjusting for inflation, the average physician’s net income from the practice of medicine, adjusted for inflation, dropped 5% (Reed and GReed & Ginsburg, 2003).
In 2006, the median compensation for specialty and primary physicians grew only 1.7% ($322,259) and 2% ($171,519), respectively; this was slower than the 3.2% increase in the Consumer Price Index (Figure 3) (Medical Group Management Association, 2007). In comparison, healthcare costs beat the inflation by 3.5%, reaching the annual increase in primary and specialty Physician compensation during 2006 did not keep pace with healthcare costs and inflation growth rate of 6.7% (Henry J. Kaiser Family Foundation, 2006).
Back in 2001, about 20% of total national healthcare spending was accounted for by physician services, while the remaining 80% included prescription drugs, hospitalization, medical devices, and other expenses. By 2020, physician and clinical services accounted for around 15% of national health expenditure, while hospital care and prescription drug costs accounted for around 33% and 10%, respectively (CMS, 2022). In 2001, the total national healthcare expenditure was around $1.4 trillion, while in 2020, it reached about $4.0 trillion. That is a rise of almost three times over the course of two decades. The average annual inflation rate in the US was around 2.1% during this period. The Consumer Price Index (CPI), which measures the change in prices of common goods and services, it has risen by about 60% from 177.1 in January 2001 to 283.5 in May 2021. By contrast, the average salary of physicians in 2020 was around $243,000. This represents a 23% increase compared to the average salary in 2001, which was around $198,000 (CMS, 2021).

Figure 3 Disparity between Healthcare costs, Consumer Price Index, and Physician Compensation 2001-2020
While many experts are busy trying to find solutions to the problem of rising healthcare costs, we ask a different question: how can such a disparity be possible without a deliberate and systematic strategy against healthcare providers?
References
- Borger, C., Smith, S., Truffer, C., Keehan, S., Sisko, A., Poisal, J., & Clemens, M. K. (2006, February 22). Health spending projections through 2015: Changes on the horizon. Health Affairs Web Exclusive, W61.
- BROWER, A. (2005). Biotech-Pharma Partnerships Reach All-Time High. Biotechnology Healthcare, 2(4), 18–20. https://www.ncbi.nlm.nih.gov/pmc/articles/PMC3564334/
- Bush, Speech at Baptis Bush, G. W. (2004, January 26). President Bush calls for medical liability reform. Speech at Baptist Health Medical Center, Little Rock, AR. http://www.whitehouse.gov/news/%20releases/2004/01/20040126-3.html
- CHCF. (2022, October 18). 2022 Edition — Health Care Costs 101. California Health Care Foundation. https://www.chcf.org/publication/2022-edition-health-care-costs-101/
- CMS. (2021, December 15). National Health Spending in 2020 Increases due to Impact of COVID-19 Pandemic | CMS. Www.cms.gov. https://www.cms.gov/newsroom/press-releases/national-health-spending-2020-increases-due-impact-covid-19-pandemic
- CMS, 2022, National Health Expenditures 2021 Highlights, https://www.cms.gov/files/document/highlights.pdf
- Dubin, C. H. (2004). A one-two punch: Drug/medical device combination products are taking healthcare in a new direction. Is the pharmaceutical industry prepared? [Electronic version]. Drug Delivery Technology, 4(4).
- Dyrda, L. (2022, March 4). Defensive medicine is costing healthcare billions. Www.beckersasc.com. https://www.beckersasc.com/asc-news/defensive-medicine-is-costing-healthcare-billions.html
- Ernst & Young. (2006, April 4). Double-digit Growth Pushes Biotechnology Industry Revenues Over $60 Billion. Ernst & Young. http://www.ey.com/GLOBAL/content.nsf/%20International/Media_-_Press_Release_-_Beyond_Borders_2006
- Espicom Business Intelligence. (2006, August 24). Research and Markets: The USA Is Home to Most of the World’s Major Manufacturers, Such as Pfizer, Merck & Co and Bristol-Myers Squibb. BNET Business Network Website. http://findarticles.com/p/articles/%20mi_m0EIN/is_2006_August_24/ai_n26967360
- Grandview Research, 2023, https://www.grandviewresearch.com/industry-analysis/drug-device-combination-market
- Henry J. Kaiser Family Foundation. (2006, September 26). Health Insurance Premium Growth Moderates Slightly in 2006, But Still Increases Twice as Fast as Wages and Inflation. Henry J. Kaiser Family Foundation. http://www.kff.org/insurance/ehbs092606nr.cfm
- Infographic: U.S. Healthcare Spending. (2023). Infographic: U.S. Healthcare Spending. Pgpf.org; pgpf.org. https://www.pgpf.org/infographic/infographic-us-healthcare-spending
- John, T. (2023, May 29). AI in RCM: Benefits, Use Cases & Case Studies | Plutus Health. Plutus Health Inc. https://www.plutushealthinc.com/post/ai-in-revenue-cycle-management-how-it-improves-rcm-efficiency-and-revenue
- Kane, L., (2020), Medscape Physician Compensation Report 2020, https://www.medscape.com/slideshow/2020-compensation-overview-6012684
- Mather, M., Scommegna, P., & Kilduff, L. (2019, July 15). Fact sheet: Aging in the united states. PRB. https://www.prb.org/resources/fact-sheet-aging-in-the-united-states/
- Medical Group Management Association. (2007). Increases in Primary, Specialty Physician Compensation Fail to Keep Up with Inflation: Physicians Continue Working Harder for Smaller Pay Increases. Medical Group Management Association. http://www.mgma.com/press/default.aspx?id=14286
- Gallegos, A., (2021), Medscape Malpractice Report 202, | November 19, 2021, https://www.medscape.com/slideshow/2021-malpractice-report-6014604
- National Coalition on Health Care. (n.d.). Health Insurance Costs. National Coalition on Health Care. Retrieved January 4, 2008, from http://www.nchc.org/facts/cost.shtml
- Reed and GReed, M/C., & Ginsburg, P. B. (2003, March). Behind the Times: Physician Income, 1995–99 (Data Bulletin No. 24). Center for Studying Health System Change Website. http://www.hschange.org/CONTENT/544/
- Richter, S. (2007). Combination Products: Navigating Two FDA Quality Systems. Agawam, MA: Microtest. http://www.microtestlabs.com/combinationpaper/0750506ComboWhitePaper.pdf
- Sethi, M. K. (2010). Defensive Medicine: “Glowing” with Pain. Psnet.ahrq.gov. https://psnet.ahrq.gov/web-mm/defensive-medicine-glowing-pain
- Soo, N., Ghosh, A., & Escarse, J. J. (2007, September). The Effect of Health Care Cost Growth on the U.S. Economy. ASPE. https://aspe.hhs.gov/reports/effect-health-care-cost-growth-us-economy-0
- Statista. (2022). Health spending distribution by category U.S. 2013-2021. Statista. https://www.statista.com/statistics/246932/health-spending-distribution-in-the-us-by-category/
- Statista, 2023, Revenue of the worldwide pharmaceutical market from 2001 to 2022, https://www.statista.com/statistics/263102/pharmaceutical-market-worldwide-revenue-since-2001/
- Strazewski, L. (2022, June 2). Pandemic helped drive health spending past $4 trillion in 2020. American Medical Association. https://www.ama-assn.org/delivering-care/patient-support-advocacy/pandemic-helped-drive-health-spending-past-4-trillion-2020
- Toussaint, J. S., & Correia, K. (2018, March 19). Why Process Is U.S. Health Care’s Biggest Problem. Harvard Business Review. https://hbr.org/2018/03/why-process-is-u-s-health-cares-biggest-problem
- Turk, P. (2022, January 17). Estonia and Singapore: Cooperation between two “digital tigers.” Unravel. https://unravel.ink/estonia-and-singapore-cooperation-between-two-digital-tigers/
A Future Book Publication Note:
This article is a chapter in the forthcoming 2nd Edition book “Medical Billing Networks and Processes,” authored by Dr. Yuval Lirov and planned for publication in 2024. We will post more chapters on this blog soon.


